Public single-cell databases now contain over 140 million human cells spanning hundreds of tissues, diseases, and age groups. In principle, this is an unprecedented resource for drug discovery: you could ask questions like “which diseases show elevated stress response in astrocytes?” or “how does immune cell composition change with age across tissues?”
In practice, nobody does this. The data is too heterogeneous. Metadata is inconsistent. Statistical modeling requires careful attention to batch effects, donor demographics, and tissue-specific confounds. Most researchers look at one dataset at a time.
I built a system to change that.
Automated Atlas Construction
The first challenge is simply knowing what’s available. For any cell type of interest, how many donors exist across which tissues, diseases, and age brackets?
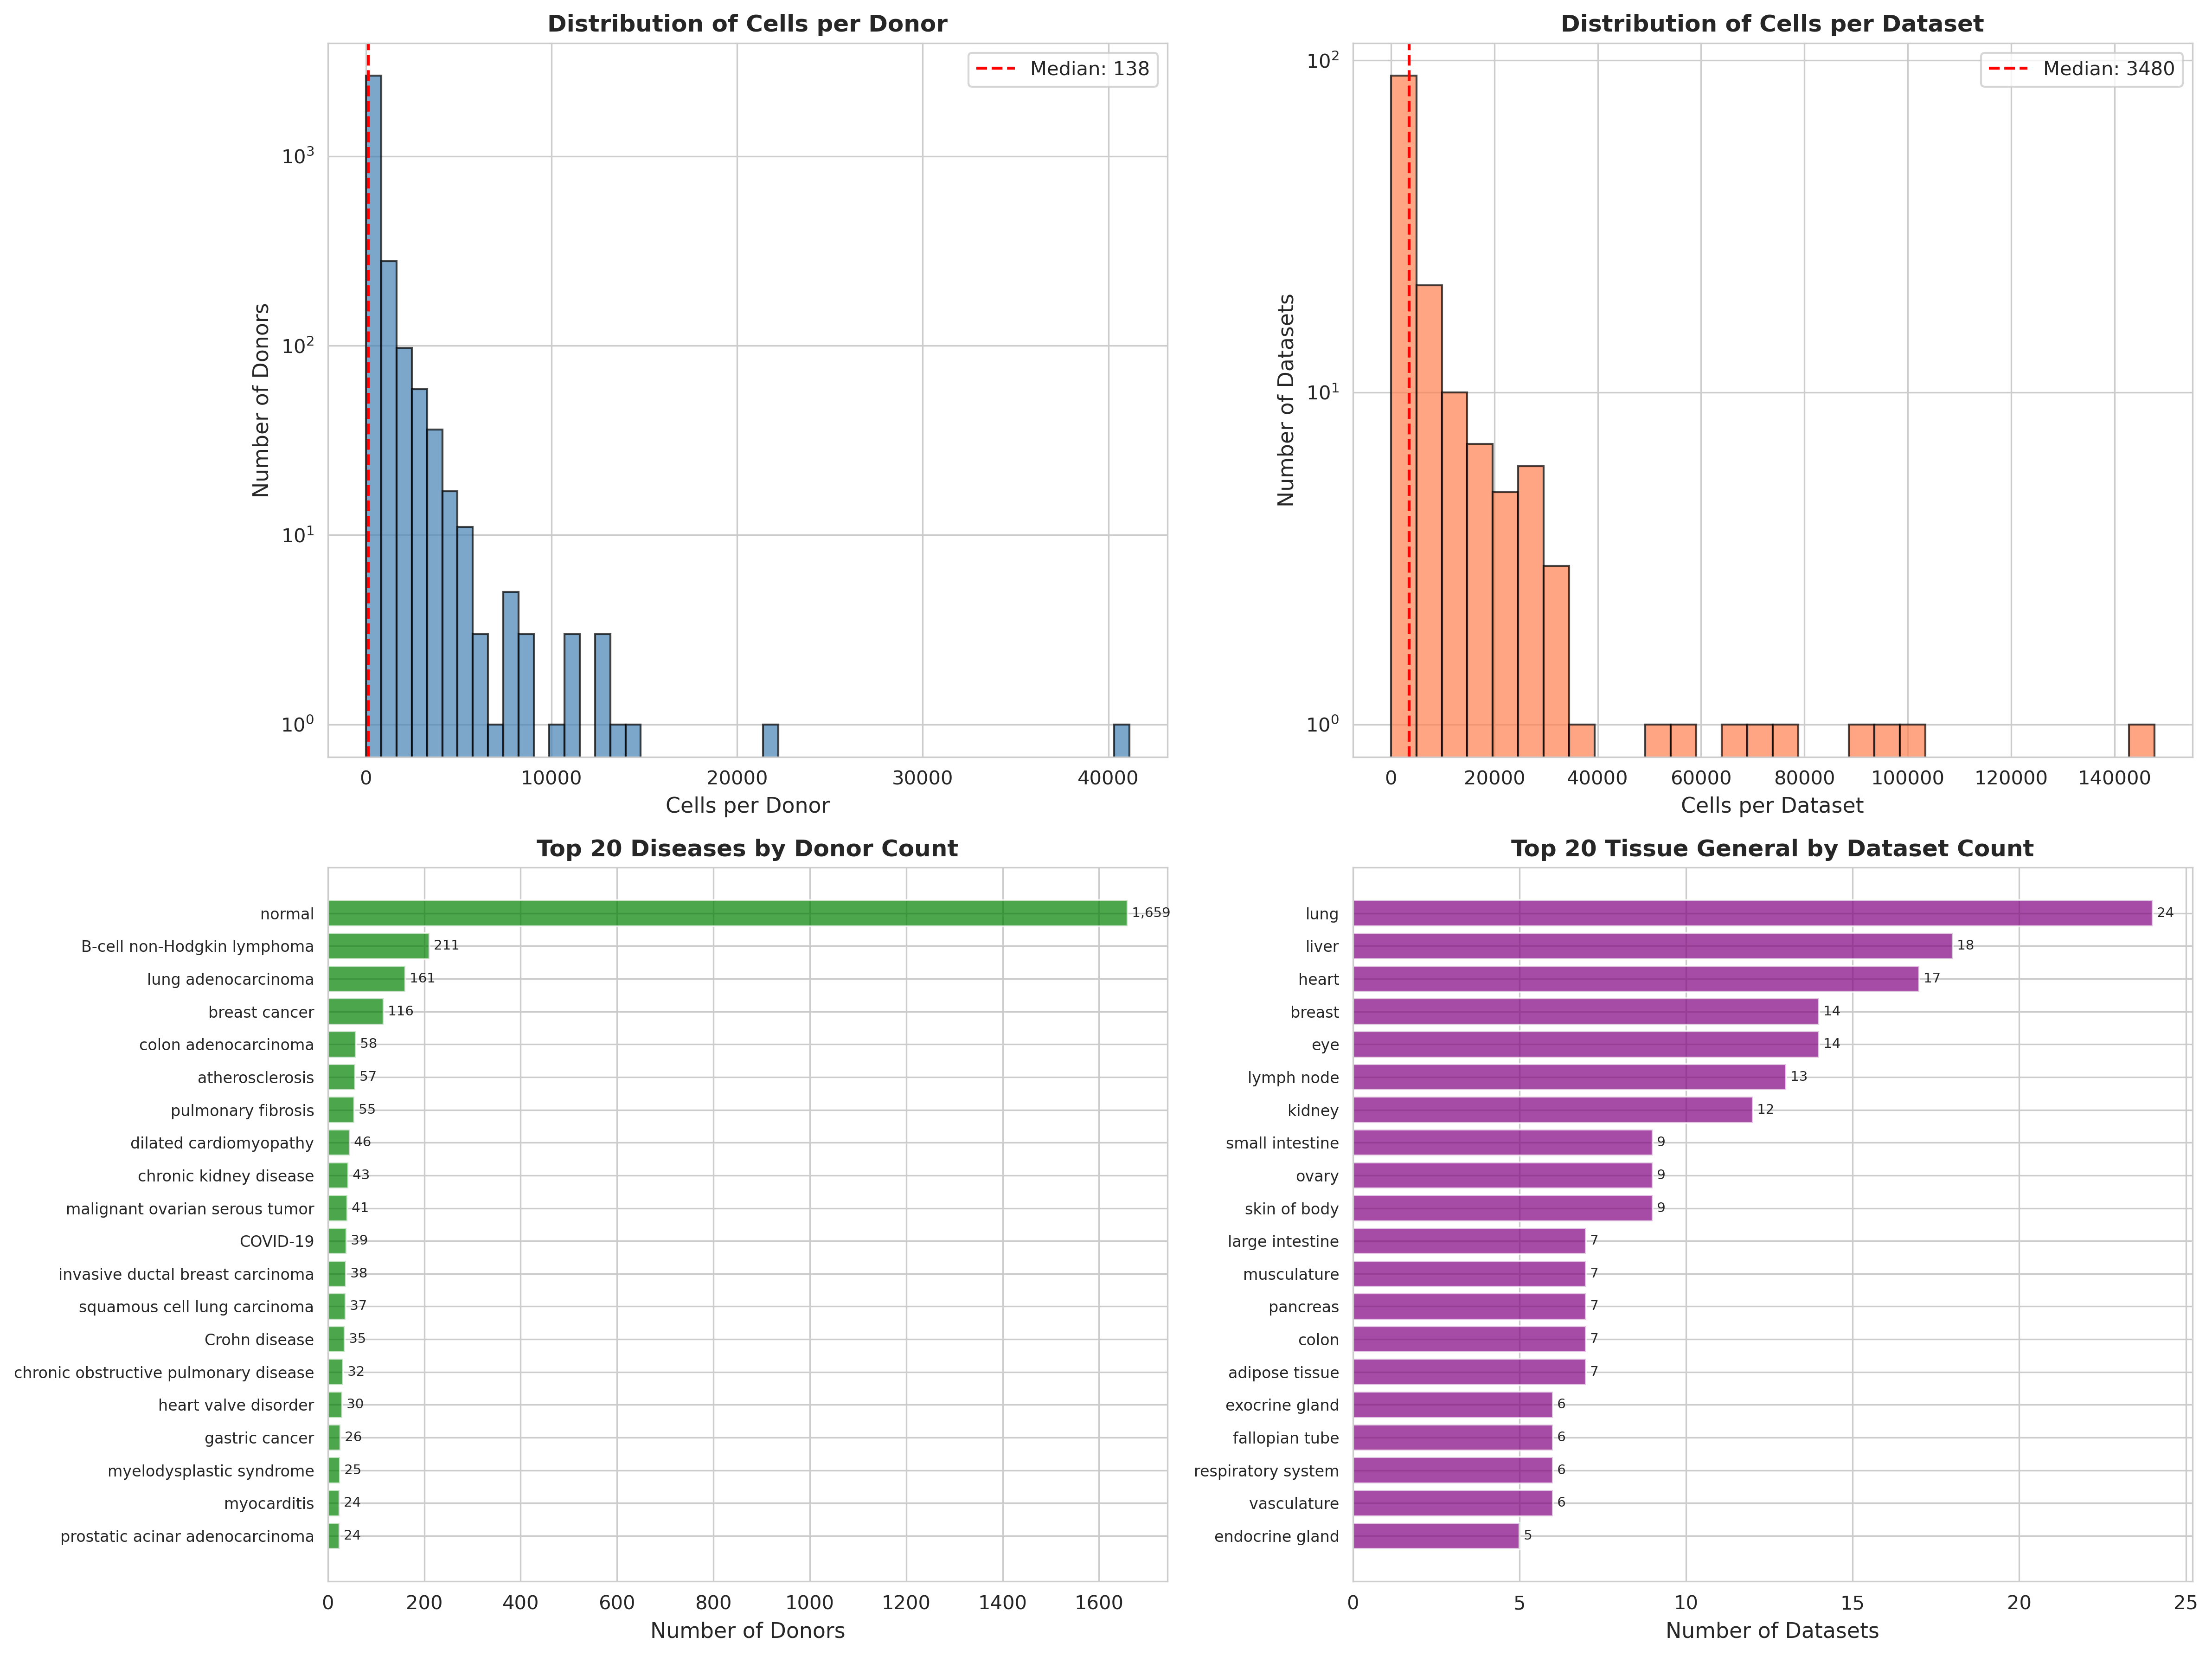
 Automated audit of the CZI Census database for endothelial cells. Top panels show cell and dataset distributions. Bottom panels reveal coverage: 1,659 normal donors, 20+ disease conditions including lung adenocarcinoma, breast cancer, and pulmonary fibrosis.
The system automatically queries the database, filters for quality, and generates coverage maps showing exactly where statistical power exists.
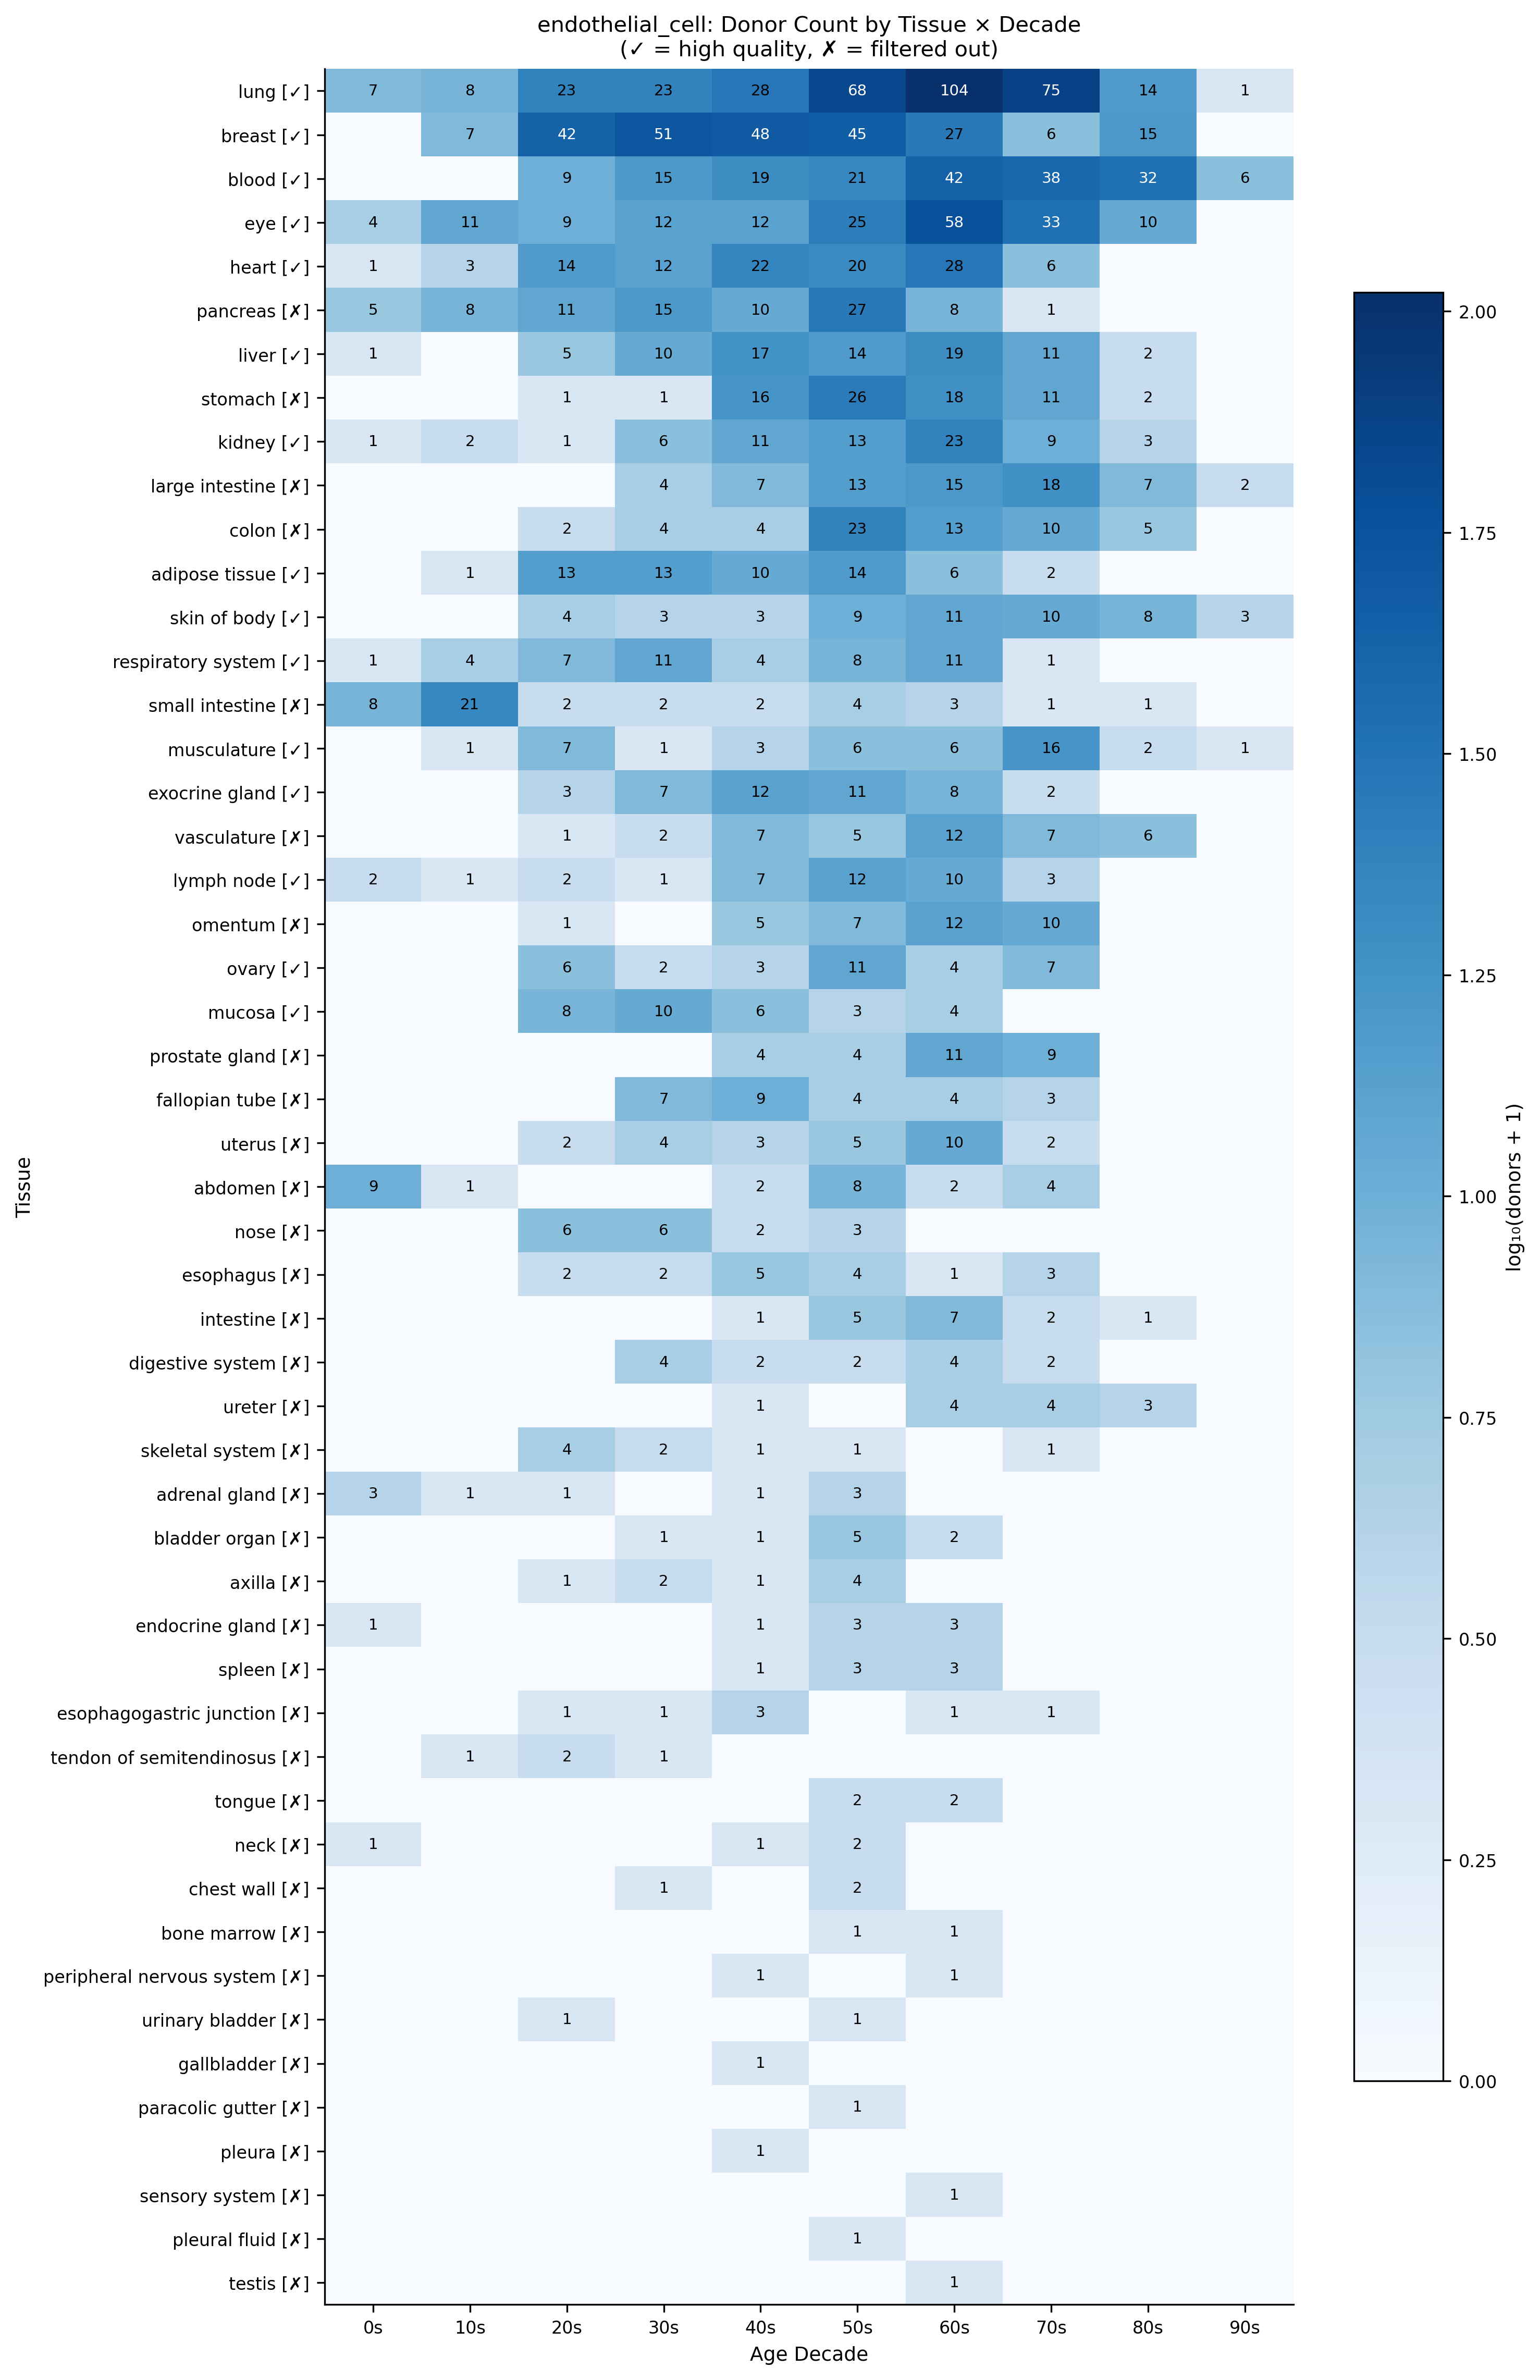 Donor coverage for endothelial cells across tissues and age decades. Checkmarks indicate tissues passing quality filters. This reveals that lung, breast, blood, and eye have sufficient coverage for aging analysis across the full human lifespan.
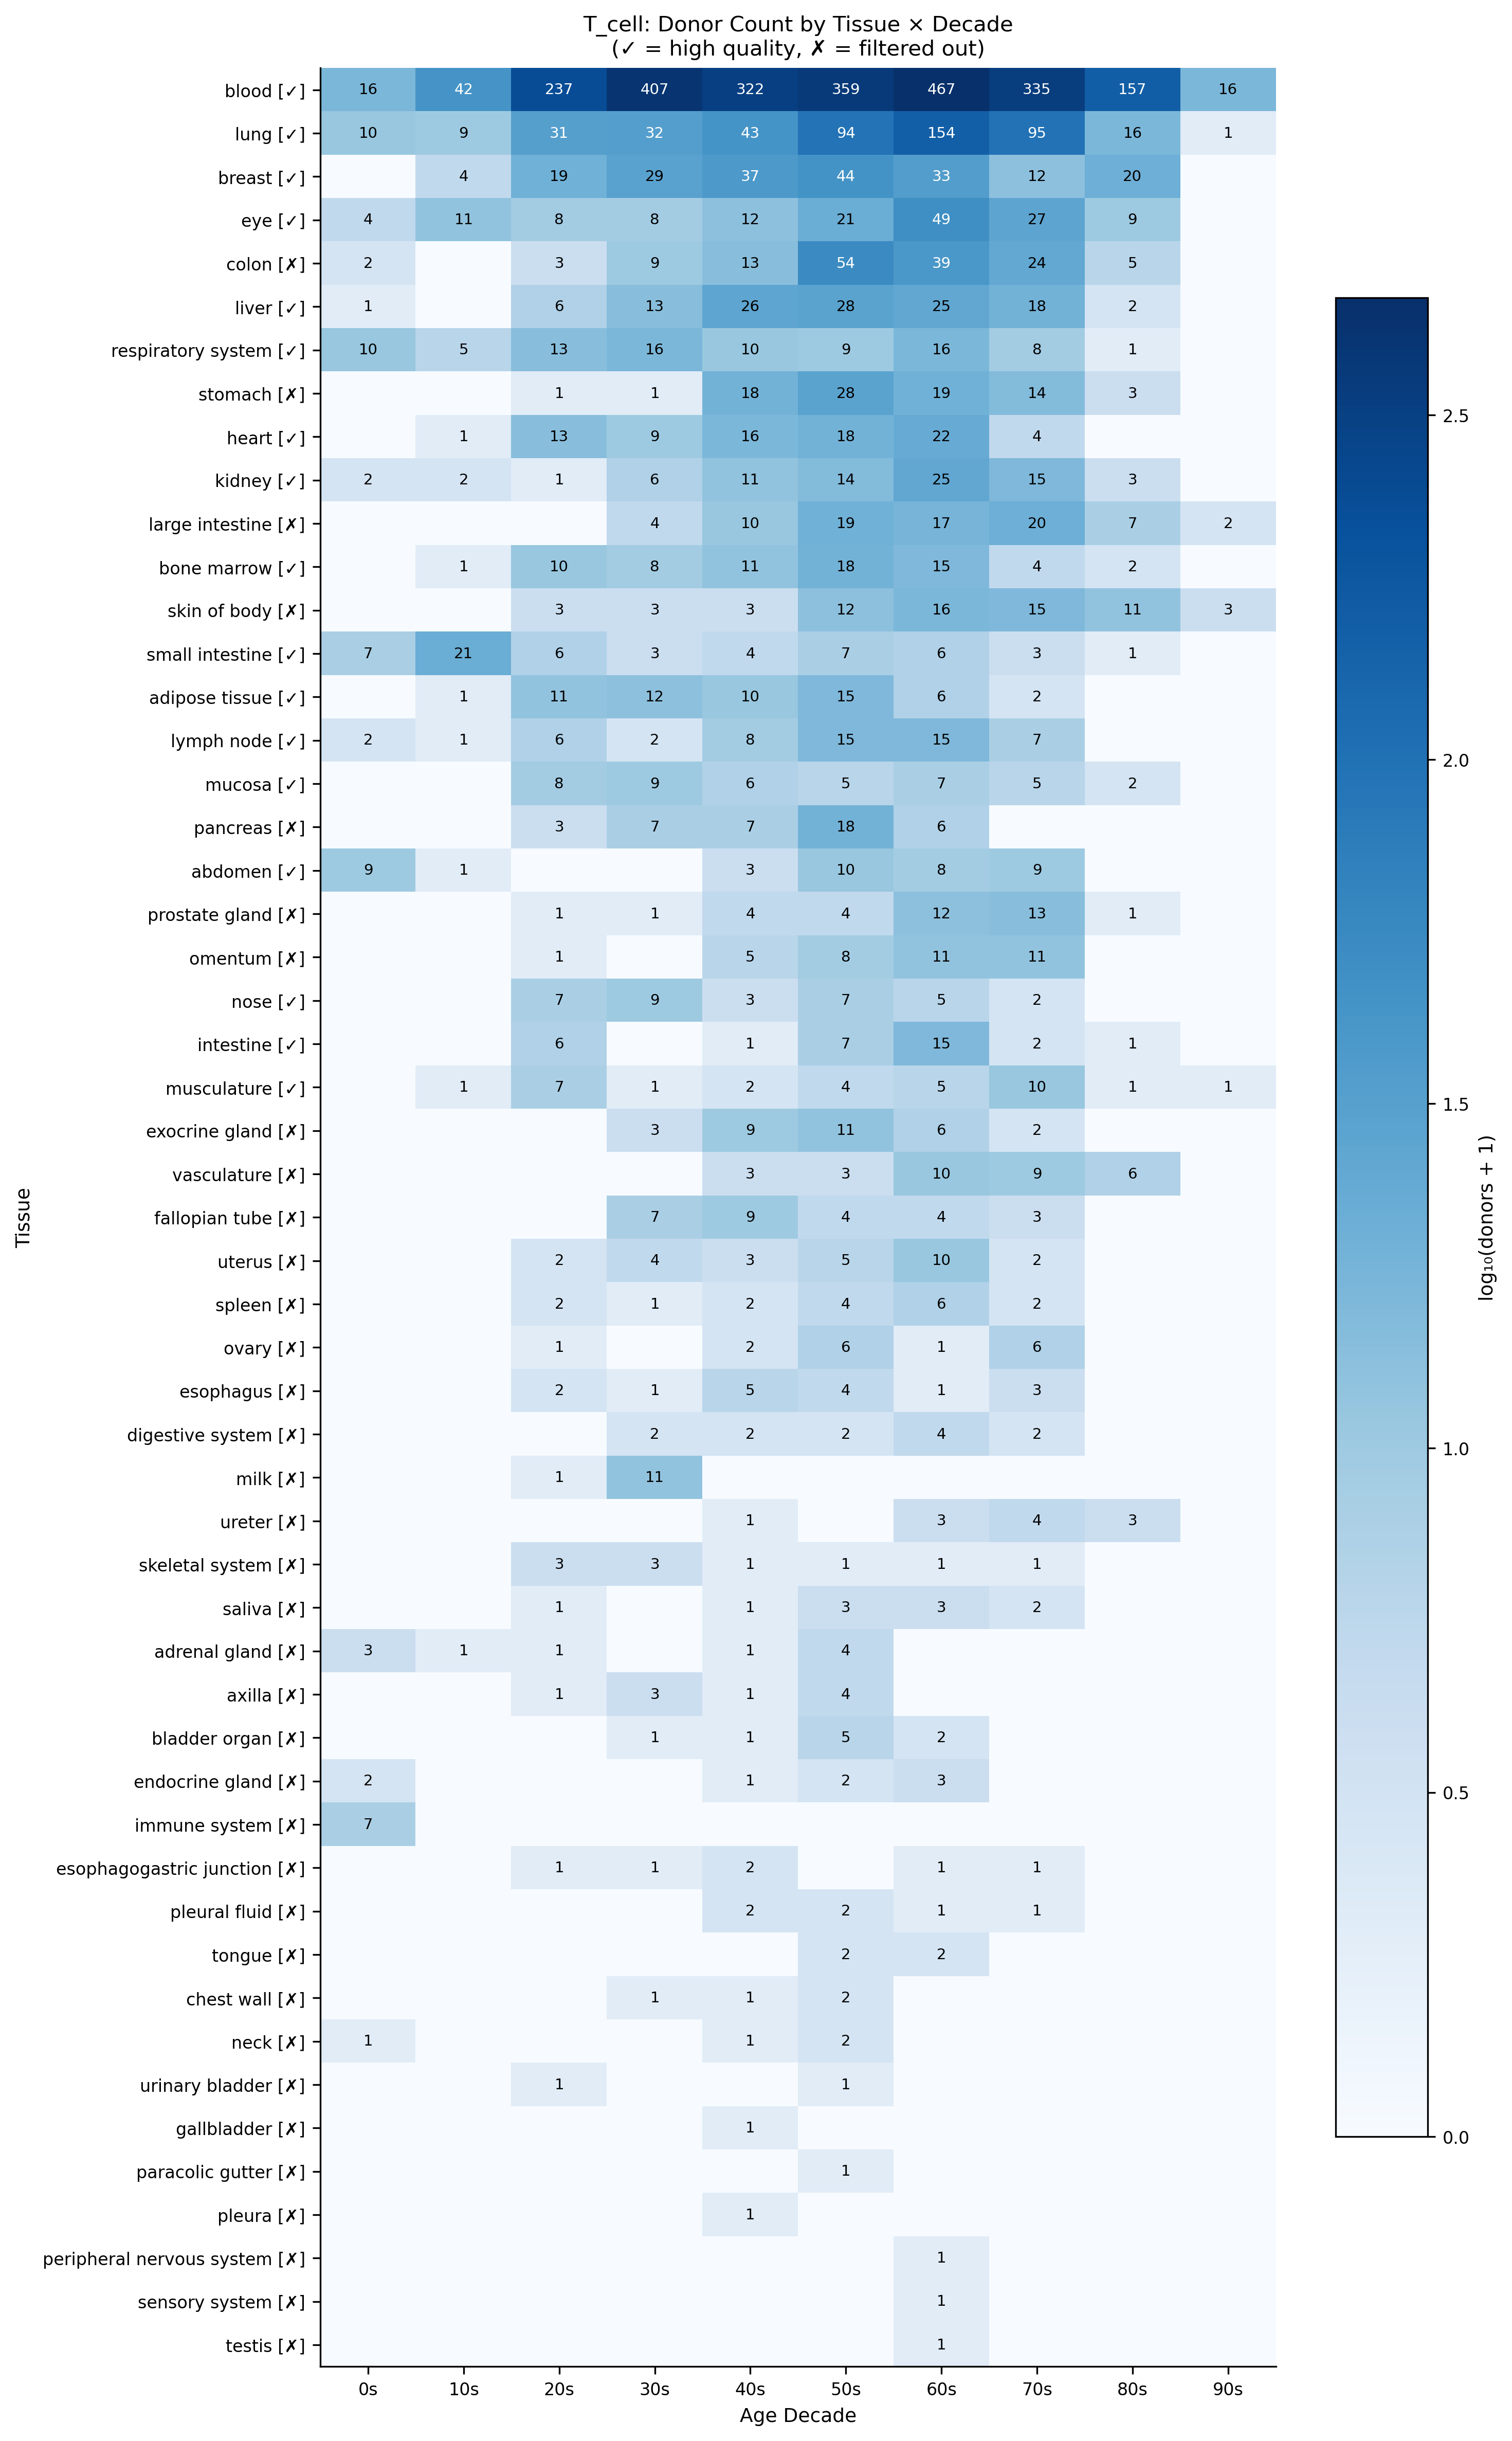 The same analysis for T cells reveals different coverage patterns—blood dominates with 2,000+ donors, enabling robust aging signatures in immune populations.
Statistical Framework for Disease Screening
Raw cell counts aren’t enough. To ask “is pathway X elevated in disease Y,” you need proper statistical modeling that accounts for:
- Pseudobulk aggregation: Averaging cells per donor to avoid pseudoreplication
- Batch effects: Different datasets use different protocols
- Demographics: Age, sex, and tissue all confound disease signals
- Multiple testing: Screening dozens of diseases requires FDR correction
I implemented a linear mixed model framework that handles all of this automatically. The agent decides the appropriate model structure based on data properties—enough donors? Sufficient age range? Batch effects present?
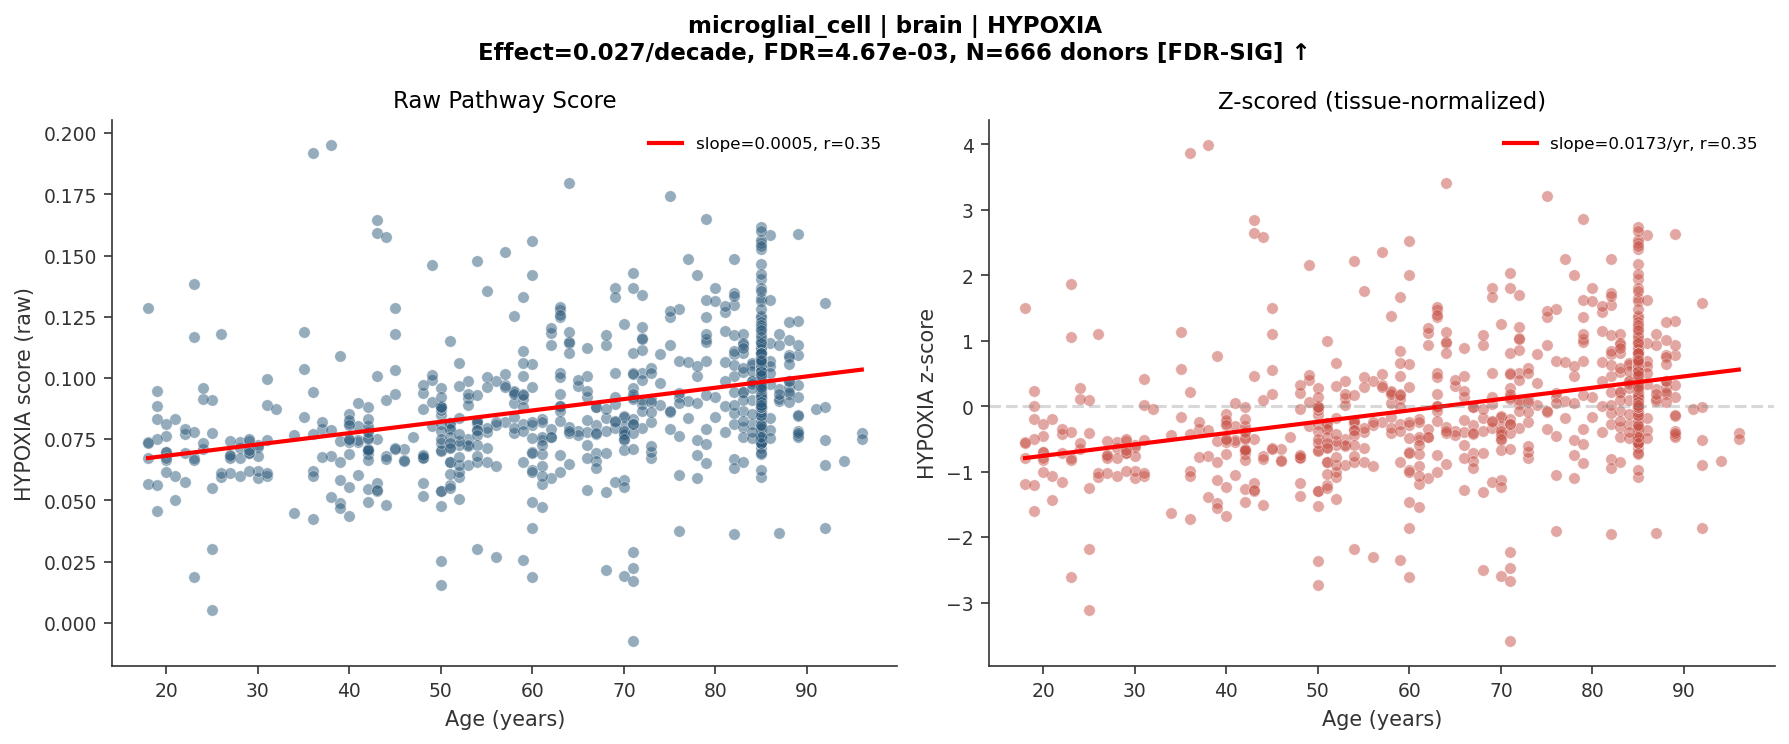 Example output: HYPOXIA pathway score in brain microglial cells increases significantly with age (FDR = 0.005, N = 666 donors). Left: raw scores. Right: tissue-normalized z-scores. This kind of analysis—previously requiring weeks of custom code—now runs in minutes from a natural language prompt.
Real Impact
This isn’t academic. Using this system, I identified pulmonary fibrosis as a potential indication for a therapeutic target by screening fibroblast signatures across all available diseases. That finding is now being pursued in drug development.
The same framework screens 3 million cells across 10 diseases in under an hour, starting from a natural language prompt like “screen ISR signature in astrocytes across neurodegenerative diseases.”
What excites me most: by compiling all normal controls across the database, we get human aging data for free. The system can test any gene signature for age-association in any cell type—a resource that would be prohibitively expensive to generate prospectively.